
Hashes to hashes
08 Feb 2016Okay. So this post was supposed to be about running on a cluster. I promise we will come to that eventually, but this week I got a bit side-tracked. Serendipity happened! We will have to dive into Rust HashMaps characteristics.
Where were we?
We are still working on “Query2”, a simple groupby/sum query over uservisits, and trying to see how fast we can get it to run on today hardware.
  SELECT SUBSTR(sourceIP, 1, X), SUM(adRevenue)
    FROM uservisits
GROUP BY SUBSTR(sourceIP, 1, X)
The BigData benchmark provides the following performances for a 8$/hr AWS cluster. Note there is a hardware section than can be unfolded.
| Query | X | group count | Hive | Shark | Redshift |
|---|---|---|---|---|---|
| 2A | 8 | 2,067,313 | 730s | 83s | 25s |
| 2B | 10 | 31,348,913 | 764s | 100s | 56s |
| 2C | 12 | 253,890,330 | 730s | 132s | 79s |
I chose to use my laptop instead (mid-2014 MacBook Pro Retina).
My first attempts for 2A were in the realm of 650-800 seconds, but, we found some nice optimisations last week:
- re-encoding the data got us at 135 seconds,
- pre-allocating intermediary HashMap at the right capacity got us at 80 seconds.
At that point, I felt pretty good. I felt ready to try and go to the cluster.
First of all, I went to try my timely dataflow implementation of Query2 locally, on the laptop. I was expecting it to be performing a bit less efficiently than my hand-crafted implementation. After all, timely introduces a few abstractions and some complexity, so…
Well, timely 2A ran in 60 seconds. That’s 25% better than my best so far.
So what’s happening here? It turns out the “natural” way to implement the groupby in timely is slightly different than by hand.
Hashes to hashes
First let’s see how the hand-made runner works.
- the final result is aggregated in a structure made of 256 rust HashMap.
Each one of these HashMap is wrapped in its own Mutex. Basically, this structure is
Vec<Mutex<HashMap<K,V>>>. It also has a “partitioner” function, which will hash the key and send id to one of these 256 “buckets”. - a queue and a pool of worker threads will go through each one of the 2037 input chunks. One chunk, one task.
- each task read, decompress one chunk and feeds its own 256 intermediary HashMap using the same partitioner than the final result. Once it is done with the file, it merges each one of the 256 intermediary HashMap to the corresponding bucket of the global HashMap.
- in the end the actual result is spread in a 256 HashMaps
The timely dataflow runner does things a bit differently.
- we start a fixed number of worker thread and distributes the input chunks evenly and arbitrary accross them.
- each worker performs several “subtasks” pseudo-concurrently:
- read and decompresse the input chunks it is responsible for
- build the
(K,V)pairs from the files and exchange them with its counterparts worker according to, again, a partitioner acting on K - receives pairs from the other workers and build its part of the final results as a HashMap
- in the end the actual result is spread in as many HashMaps as we had workers
In short, timely bucketize the data then hash it, whereas the hand-made runner bucketize and hash separately the data of each input chunk before merging each chunk bucket.
Now remember how dominant HashMap manipulations where showing in the FlameGraphs last week? Well, each bit of data gets inserted twice in a HashMap in the hand-made implementation and only once in the timely implementation…
The rationale behind doing a first stage aggregation at the worker level was to reduce the volume of data to be inserted in the final HashMap buckets, and thus reducing lock contention on the bucket mutexes. It may have been a (bad case of) premature optimisation. Just cast the first stone if you feel like it.
What if we just use regular Vec instead of HashMap for the worker buckets?
Guess what. Yep. 60 seconds. So timely and the hand-made runner are in the same ball park. Phew.
Fixing Query2C
Were are we so far ?
| Query | X | group count | Hive | Shark | Redshift | Me so far |
|---|---|---|---|---|---|---|
| 2A | 8 | 2,067,313 | 730s | 83s | 25s | 60s |
| 2B | 10 | 31,348,913 | 764s | 100s | 56s | 93s |
| 2C | 12 | 253,890,330 | 730s | 132s | 79s | 255s |
So we are doing a bit better than Shark on 2A and 2B, but something unpleasant happens in 2C.
Let’s have a look at some metrics.
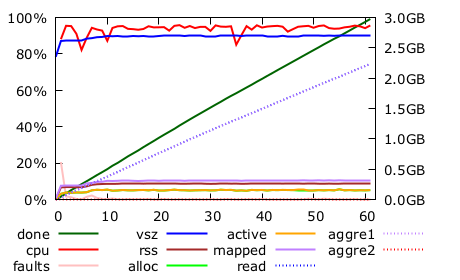
2A…
and 2C.
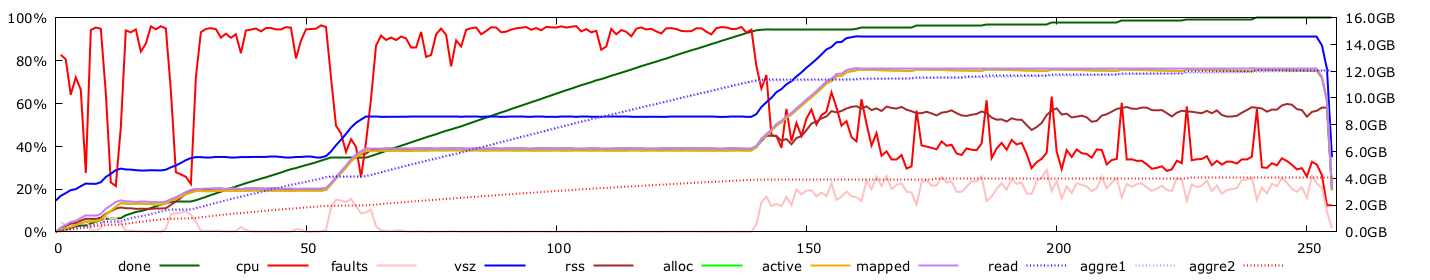
These graphs show many things, but of particular interest are:
- the green line showing the progress of the processing (we want this to be a straight line from bottom left to top right)
- the red line shows how heavily the CPUs are used (in percent)
- the purple line show how much memory space the process use
- the brown one show how much of this address space is physically in memory. The rest is swapped to disk — or SSD.
So, at about 140s and 95% of the work done, 2C tries to roughly double its memory space and starts swapping. What is happening is, again, HashMap reallocations, this time affecting the final buckets HashMap, not the intermediary ones — which we have just replaced by Vectors anyway.
You may remember that my initial evaluation of the size of the final result for 2C in the first post was about 4GB. But here, we are actually manipulating 12GB.
We have to accommodate 253M keys and values. Each key is 12 bytes, each value is 4 bytes (a 32bit float). 253M*(12+4)=4GB.
Well, reality is a bit different. First of all there is the capacity management issue. To keep doing its work fast, a HashMap has to waste some space. Rust HashMap needs at least 10% of empty space in it. If it get above this mark, it reallocates itself doubling its size. So depending on when the reallocation happens, we may need to multiply the theoretical data size by about 2.2 to get the real memory usage.
It gets worse. Rust HashMap needs a 64bit integer on each of its pair for housekeeping. So all in all, we need 253 * (12+4+8) * 1.1=6.6GB if we’re lucky with re-allocation timing or twice that if we are not.
And we are not lucky: the reallocation that kills us is triggered at 95% of the progress. Can we do something about that? Yes.
First, I tried to pre-allocate the final 256 bucket maps at the “right” capacity. That did not work: rust HashMap wants its raw capacity to a power of two, so it was picking the same value than the one it can barely holds after the last reallocation… I was putting the process in the desperate state of swapping at the very beginning. That was very counter productive.
But… I can also very easily change the number of partition buckets. Bumping it from 256 to 300 made enough room in the buckets to delay the dramatic reallocation. And we get a 91 seconds run!
Partition bucket count impact
Have you noticed how this 91s point makes 2C slighly faster than our previous best for 2B?
This was unexpected. So let’s try 2A and 2B with 300 buckets too… 54 and 64! We’re getting better at this, but we don’t know why.
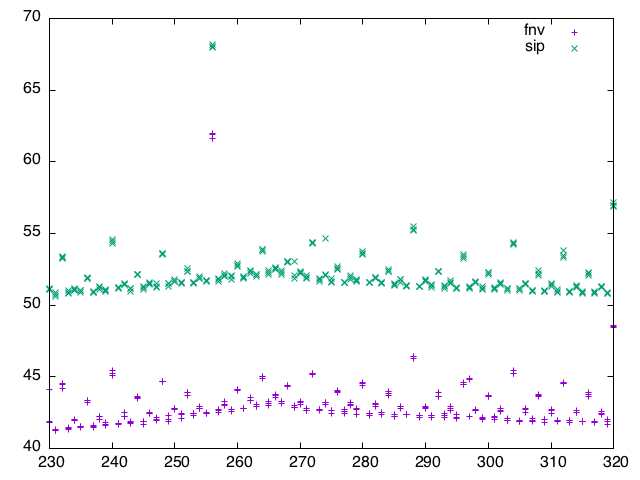
OK, we definitely need more data. It becomes increasingly difficult to get reliable measurements on the laptop as we eliminate fat everywhere, but I have consistent measurement on the more quiet linux boxes. Running times for Query2B on the linux server boxes, with partition from 230 to 320 buckets.
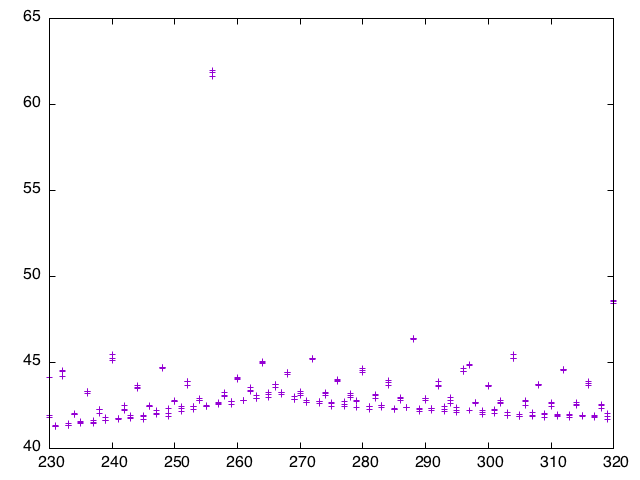
Mmm…
So there is some kind of long-term variation, maybe related to the values that could avoid one more turn of HashMap reallocation. But the short term looks pretty interesting :) There is a strong correlation between the highest power-of-two in the factorization of the bucket count and the time: every other fourth value is a local peak, every other eighth value is a higher local peak and so on until the 256 value which is dreadful.
Let’s check out the FlameGraphs. I even managed to get the SVG working this time. First one is 2B with 256 buckets, second one with 257.
Can you spot the difference? Click on the nearly invisible “Search” button top right of the first one and type “Full” in there… See that FullBucket stuff ? Smells like collisions :) There is some kind of resonance happening between the partitioner and the HashMap hasher.
Partitioners and hashers
Bottom line is hash(key)%bucket.len() partition data in a way that will
generate an important number of collision in the buckets. With 256
buckets, we are just partitioning the data using the last 8 bits of the hash.
I tried to get more entropy (from the 7 other bytes) by adding some salt:
What I am doing is hash("noiz"+key)%bucket.len() instead.
As we are talking about hashers, several people have told that I would probably benefit from using the FNV hasher instead of the default SIP hasher. I’ve actually been using FNV for a while even if it was probably a premature optimisation when I made the switch.
But it is true nonetheless that FNV slays a few % of the running time. Both SIP and FNV have the same kind of “resonance” between the partitions and the HashMap themselves. On the linux boxes:
Running times for Query2A on my laptop with different partitioner and hasher tweaks:
| bucket size | sip | fnv | salted fnv |
|---|---|---|---|
| 256 | 68s | 60s | 50s |
| 257 | 64s | 57s | 53s |
Recap
So in this post, I have mostly been tweaking the hash based aggregation and managed to squeeze a few more seconds out of the running time.
| Query | X | group count | Hive | Shark | Redshift | Laptop |
|---|---|---|---|---|---|---|
| 2A | 8 | 2,067,313 | 730s | 83s | 25s | 50s |
| 2B | 10 | 31,348,913 | 764s | 100s | 56s | 64s |
| 2C | 12 | 253,890,330 | 730s | 132s | 79s | 91s |
Next week, I promise, we’ll have fun with timely dataflow and clusters.
Rust and BigData series: