
Playing with Rust part 2
03 Sep 2014Part 2 of my adventures with Rust and the busy beaver.
Performance
Rust aims at delivering the same performance than C. I tried it. And yes, I’m aware it leaks the tape buffers.
On my test machine (my new Macbook pro), the C implementation runs in 500ms and the rust one in 2.190s. Ouch.
Well, my implementation is certainly naive, so let’s try to improve that. First, I tried to discard some of the possible source of bias by running the computation 10 or 100 times in a loop, with no significant difference. And being a Java/Scala long time user, believe me, I consider that good news.
As I felt the implementation of step was inadequate anyway, I made it look better before going any further: I use get_mut on the tape vectors to obtain the mutable tape cell I will read and write instead of performing index computations and de-referencing twice. This allows the loop to run in 1.500s instead of 2.2s. Nice progress, and the code looks better. And the hidden underflow/overflow check costs starts to make a blip on my radar.
Instruments
As rust binary is just that, a binary, all standard profiling tools will work, starting with Instruments. I recompiled with -g to get a nice .dSYM directory, and ran the beaver through instruments (with a 10 times loop).
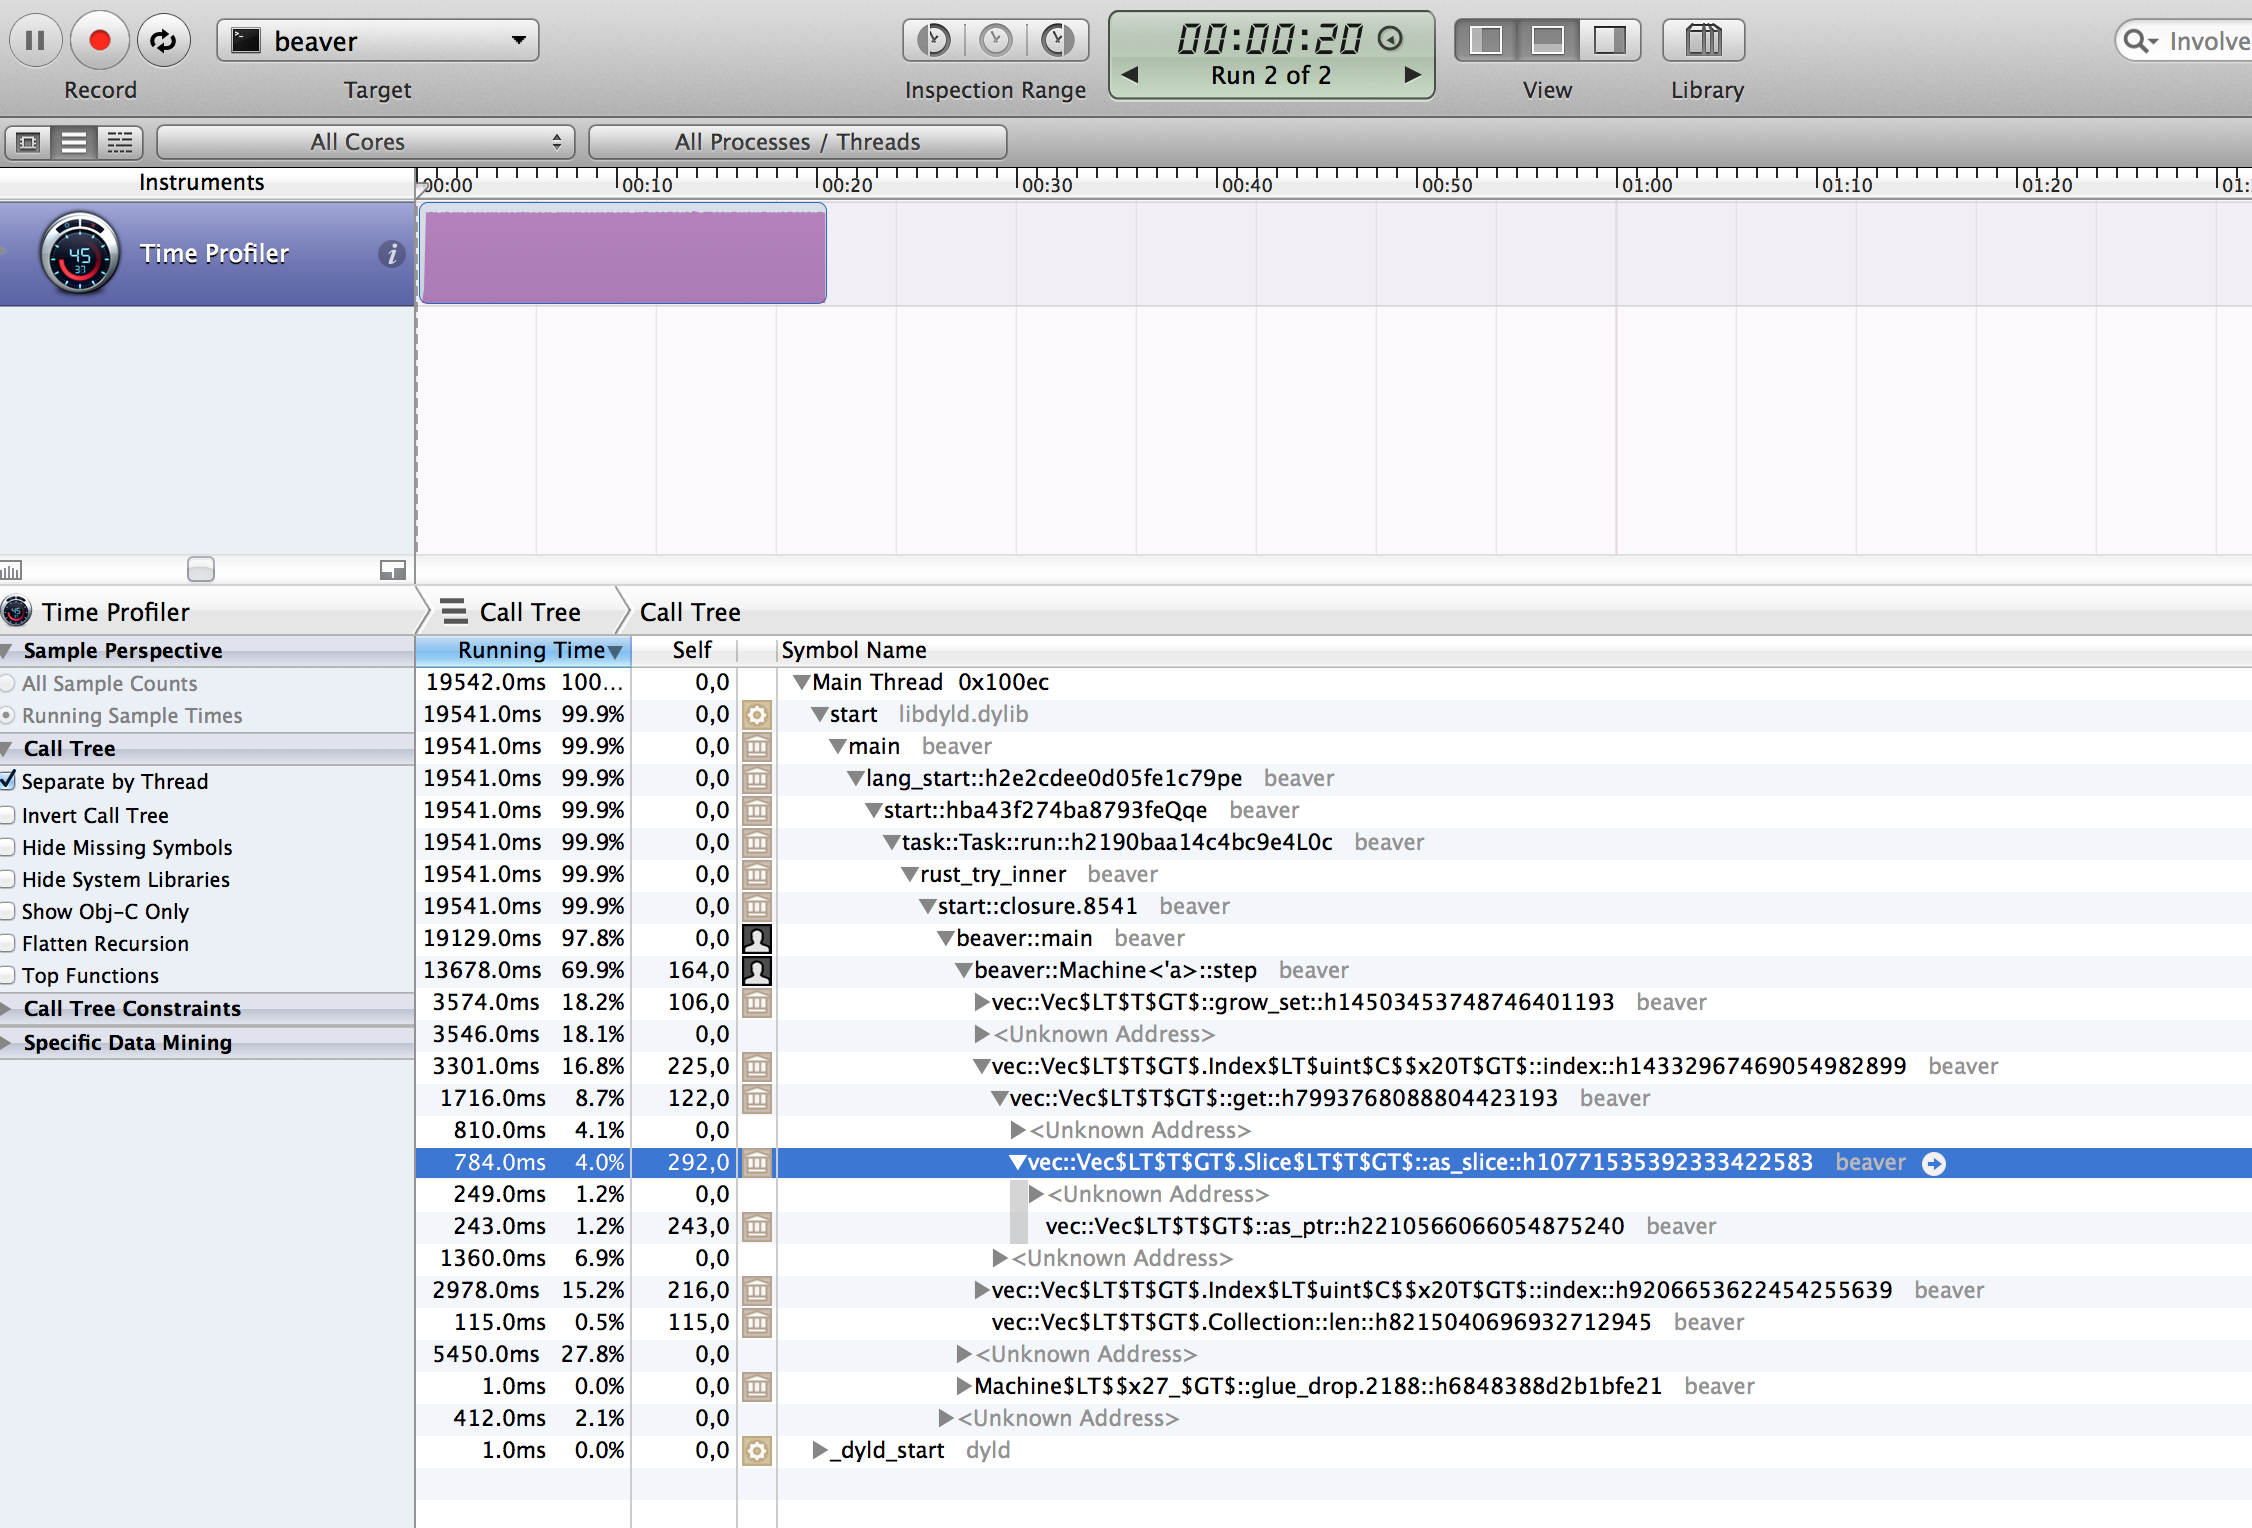
After a few clicks in Instruments, I managed to get that:
 </img>
In this profile, despite a few weird things, we can spot some room for improvements. It’s a shame we don’t have line profiling, but let’s try to understand what is what:
1
2
3
4
5
6
7
8
9
10
11
12
13
14
Running Time Self Symbol Name
13138.0ms 97.1% 0,0 beaver::main
8180.0ms 60.4% 118,0 beaver::Machine<'a>::step
3435.0ms 25.3% 144,0 vec::Vec$LT$T$GT$.Index$LT$uint$C$$x20T$GT$::index::h743663999860458997
2331.0ms 17.2% 0,0 <Unknown Address>
1352.0ms 9.9% 1352,0 vec::Vec$LT$T$GT$::get_mut::h344444305589106638
762.0ms 5.6% 762,0 vec::Vec$LT$T$GT$.Index$LT$uint$C$$x20T$GT$::index::h743663999860458997
217.0ms 1.6% 217,0 vec::Vec$LT$T$GT$.Collection::len::h2055299862459425766
2189.0ms 16.1% 213,0 vec::Vec$LT$T$GT$::get_mut::h344444305589106638
104.0ms 0.7% 104,0 vec::Vec$LT$T$GT$.Collection::len::h2055299862459425766
3.0ms 0.0% 0,0 vec::Vec$LT$T$GT$::grow_set::h4022711321732091745
4956.0ms 36.6% 0,0 <Unknown Address>
4956.0ms 36.6% 4956,0 beaver::Machine<'a>::step
2.0ms 0.0% 0,0 Machine$LT$$x27_$GT$::glue_drop.2186::h36020354f131ac5f
Line #9 show a get_mut, so it’s for the cell tape extraction. Line #10 and #11 are probably the “tape overflow” check and growing tape, as the code make use of grow() and len() and the symbols just show.
The line #4 is more interesting and it accounts for 25% of the cost… symbol seems to be Index… that’s the nickname for the [] operator. Damn. This is not the tape but the state vector. I used a vector. By looking the vector code in rust (it’s in src/libcollections/vec.rs right now), I see that except when the vector is asked to grow, about everything is made by calling as_slice() and then delegating the call on the slice. What is a slice already ? Something less constrained than an array (which needs to know its size at compilation time) and more constrained that a vector (the size is fixed).
I can manage this with a slice. The states vector is allocated and defined in one run. I don’t want to hardcode the number of states, so I won’t go as far as using an array, but I can convert the code to using slice.
The compiler requires me to store the state slice in its own variable, and propagate the lifecycle through the MachineDefinition, but now that I have understood this part, the compiler messages make total sense. result and diff
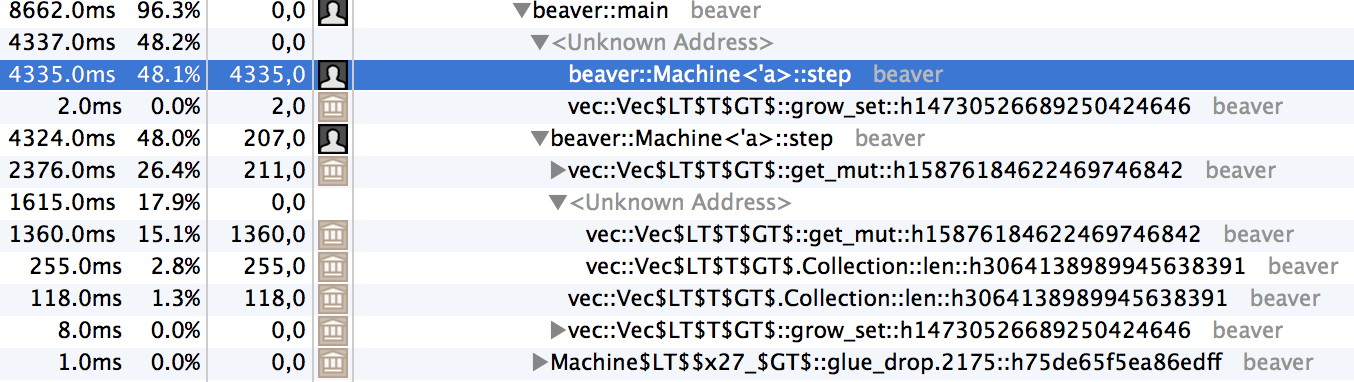
rustc, ./beaver… 1 second ! -g, Instruments…
 </img>
And… not only there is nothing obvious to look at anymore, but the “weird” stuff is all over the place now. The step() method appears twice, so does get_mut() inside step(). I assume the various method inlining is confusing the profiler, so I guess my next step would be to go check out the LLVM IR to see what is generated, but… not today.
Bottom line is, Instruments profiling helped me go from four times as slow as C to two times.